Performance indicators
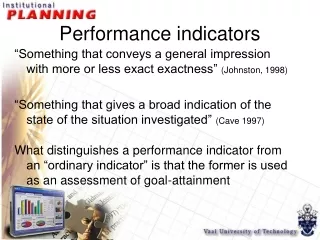
Performance indicators. “Something that conveys a general impression with more or less exact exactness” (Johnston, 1998) “Something that gives a broad indication of the state of the situation investigated” (Cave 1997)

Performance indicators
E N D
Presentation Transcript
Performance indicators “Something that conveys a general impression with more or less exact exactness” (Johnston, 1998) “Something that gives a broad indication of the state of the situation investigated” (Cave 1997) What distinguishes a performance indicator from an “ordinary indicator” is that the former is used as an assessment of goal-attainment
Performance indicators • Student data • Student’s academic progress • Staff ratios • Space utilisation
Student – performance indicators • Headcount • FTE ( Full Time equivalent) • Enrolled FTE • Weighted FTE • Degree FTE • Graduate • Weighted graduate • Research output
Credit values The credit value of a course is the fraction it constitutes of a standard full-time curriculum. The total credit value for all the courses taken by a full- time student must be assumed to be equal to 1 per study year. Minimum formal time = 3 years
Credit values Example: one year certificate: New HEQF 1 Credit = 120 SAQA credits = 1200 notional hours
Enrolled FTE Credit * total no of enrolled students
Credit values For a full time undergraduate student taking all his required courses 1 Student = 1 FTE Example: one year certificate:
IF our credit values are incorrect: When a student graduate VALPAC does the following calculation: Example of 40 diplomates who graduate from a qualification with a minimum formal time of three years: 40 * 3 N Dip XX: 138/120 = 1.15 N Dip ZZ: 57/60 = .95 ! The credits obtained may not differ more than 2% from the expected credits.
Credit values of M and D’s: credit value = k x (x1 + x2 +x3) (y1 + y2 + y3) where K = the approved formal time for the degree, x1 – x3 = the number of graduates in the 3-year period y1 – y3 = total number of years for which they were registered.
FTE Value = formal time * number of graduates/ Total time = 1 * 14 . (2+2+4+3+4+3+3+6+4+3+7+5+3+2) = 0.27
Weighted FTE 12.5 18.75 CESM 7 = Funding group 1 – Undergraduate Subject 1 = 0.125 * 6 * 1 CESM 5 = Funding group 2 – Undergraduate Subject 2 = 0.125 * 17 * 1.5
Enrolled FTE 12.5 18.75 20.75 29.05 CESM 8 = Funding group 3 – Undergraduate Subject 3 = 0.083 * 100 * 2.5 CESM 1 = Funding group 4 – Undergraduate Subject 3 = 0.083 * 100 * 3.5
Academic performance Retention rate Students that remain in the system and eventually complete their studies Throughput rate Students that complete there qualifications in the minimum formal time of the qualification Dropout rate Students that cancel after the census date. Start End ----------|------------|----------- Census date Success rate Percentage of Students that pass the exam, expressed as the total number of students registered for the course Entering students Student that drop out/cancel Students with year marks Students that pass fail Graduates Pass rate Students that pass the exam, expressed as a percentage of students that were admitted to the exam • Internal indicators • Enrolment total • Dropout rate • Pass rate • Success rate • Retention rate • Throughput
Pass FTE (Degree credits) The total of students actually passing a course is multiplied by the fraction representing the weighting the course has of a standard curriculum. The outcome of these calculations is a total of full-time (FTE) degree credits.
“The focus of the White Paper, however,is on removing the success rates in individual courses “
1 2
Teaching output units Student – performance indicators • Headcount • FTE ( Full Time equivalent) • Enrolled FTE • Weighted FTE • Pass FTE (Degree credits) • Graduates • Weighted graduates • Research output Teaching input units
Student – performance indicators • Headcount • FTE ( Full Time equivalent) • Enrolled FTE • Weighted FTE • Pass FTE (Degree credits) • Graduates • Weighted graduates • Research output Teaching output units
Research outputs Example: