Download
1 / 14
140 likes | 232 Vues
Learn how to utilize geospatial data for planning and evaluating Europe's development aid efforts, focusing on key areas such as land tenure, environmental impact assessments, and deforestation rates.

E N D
Geospatial information for planning, implementation and evaluation of Europe’s Development-Aid programmes F. Achard, A. Belward, A. Brink, H. Eva, and P. Mayaux
Europe’s relations with the wider world • The EU provides 55% of the € 70 billion of Official Development Assistance* • EU aid will be increased by € 20 billion / yr by 2010, half of which is destined for Africa** • EC-managed programmes in Africa, Caribbean and Pacific countries is c.a. € 3 billion / yr*** (*OECD) (**COM (2005) 489) (***EU Donor Atlas, 2004)
Information for EU Development-Aid policy • Water, forests, agricultural and grazing land have high economic and social value • Stable food production is a key foundation of social stability and economic growth • Natural resource use/availability are among armed conflict drivers • Environmental mainstreaming in EU aid projects is now a “legal” obligation
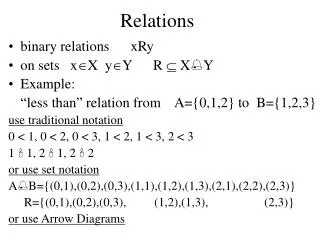
e.g. Information for land – tenure policy formulation • Land cover must be measured, • land availability & suitability calculated, • trends and history of change established.
Sample strategy • Tessellation grid • Stratification White/ UNESCO vegetation map of Africa • Sampling rate of 1% in each of the strata.
Côte d’Ivoire 1974 Côte d’Ivoire 2000 Measuring change • Land tenure issues; land cover & use; land availability
Sudan 1975 Sudan 2000 Measuring change • Land tenure issues; land cover & use; land availability
Angola 1975 Angola 2000 Measuring change • Land tenure issues; land cover & use; land availability
Cover change • 50,000 km2 of natural vegetation converted to agriculture every year since the 1970s…50% increase • But population has doubled
Goals for 2011 • User perspectives from operational policy cycle – product generation, timing, and product delivery issues • environmental impact assessments • project planning and implementation • post project audits • Project deliverables • Data merging (HR/MR) • Deforestation rates (pan tropical) • Land cover change rates (national)