Download
1 / 6
60 likes | 163 Vues
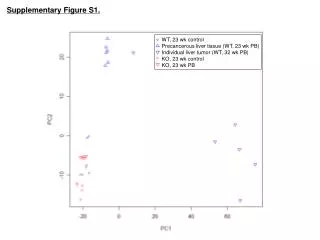
Analysis of gene expression in B6C3F1 and C57BL/6 mice after phenobarbital treatment using PCA and distribution plots. Data show similarities and differences in gene expression patterns over 2 and 4 weeks.

E N D
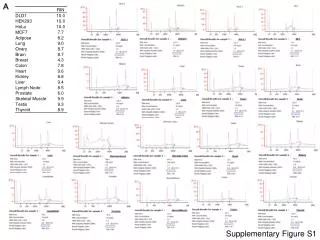
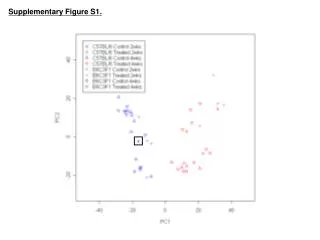
Legend - Supplementary Figure S1. Principle Component Analysis (PCA) of gene expression patterns of individual B6C3F1 and C57BL/6 mice within control and phenobarbital (PB)-treated groups at 2 and 4 weeks. Microarray analysis of RNA isolated from livers of tumor-susceptible B6C3F1 and relatively resistant C57BL/6 mice left untreated (control), or administered 0.05% (w/w) PB in drinking water for 2 or 4 weeks, was performed. PCA of data from individual B6C3F1 and C57BL/6 mice depict similarities and differences of their overall gene expression patterns. PCA is a dimension reduction technique that creates axes through the data (Principal Components; PC) that account for variability within the data set. PC1 accounts for the largest variance, PC2 is orthogonal to PC1 and accounts for the next largest variance, and so forth, until all of the variance is explained. Data from 8 groups of mice (n = 6, with the exception of the B6C3F1, 4-week PB-treated group, n = 5) are shown. Data from 1 mouse in the B6C3F1, 4-week PB group was excluded because it does not fall within the boundaries of this chart, and as such, it was deemed an outlier and not utilized for subsequent analysis. The black box contains data points for 2 separate B6C3F1, 2-week control mice; they fall directly on top of one another.
Supplementary Figure S2. 1 2 3 42 4 5 61 3 6 1 2 3 1 4 5 6 2 4 5 6 7 5 1 6 2 3 4 5 6 2 3 4 5 65 5 1 1 2 2 3 4 6 3 4 1 ^
Legend - Supplementary Figure S2. Distribution of gene expression data generated from individual B6C3F1 and C57BL/6 mice within control and phenobarbital (PB)-treated groups at 2 and 4 weeks. Microarray analysis of RNA isolated from livers of tumor-susceptible B6C3F1 and relatively resistant C57BL/6 mice left untreated (control), or administered 0.05% (w/w) PB in drinking water for 2 or 4 weeks, was performed. A “box-and-whisker” plot was utilized to express the distribution of the data. The individual animals are listed by group, along the bottom of the chart, and the normalized intensity values (in log2 form), from the microarray data, are listed along the left-hand side. The white bars represent the interquartile range (IQR), which extends from the 25th to the 75th percentiles, and the horizontal black bars within the IQR represent the median value. The “whiskers” end at + 1.5 * IQR units. Every dot (o) beyond the “whiskers” reflects an outlying data point.The 8 groups of mice (n = 6) include: B6C3F1 controls at 2 (blue) and 4 (green) weeks; B6C3F1 PB-treated at 2 (pink) and 4 (red) weeks; C57BL/6 controls at 2 (orange) and 4 (purple) weeks; and C57BL/6 PB-treated at 2 (black) and 4 (teal) weeks. One B6C3F1 4-week PB-treated animal which was deemed an outlier, and omitted from further analysis, because it fell outside the boundaries of the Principle Component Analysis (discussed in the legend to Supplementary Figure S1), also appears different in this “box and whisker” plot (^).
Supplementary Figure S3. 5’ 3’ 10 kb 2 kb 2 kb 10 kb 1) Associated with a gene A. Within a gene i. Spans transcriptional start site ( ) and/or 5’ untranslated region ii. Exon iii. Intron B. Upstream from transcriptional start site i. < 2 kb ii. < 10 kb and > 2 kb C. Downstream from last exon/intron i. < 2 kb ii. < 10 kb and > 2 kb 2) > 10 kb away from either the transcriptional start site or the last exon/intron 3) Repeat element: multiple “top” hits and one/several are associated with a gene(s) 4) Repeat element: multiple “top” hits and no hits are associated with a gene(s)
Legend – Supplementary Figure S3. Classification of unique phenobarbital (PB)-induced regions of altered DNA methylation (RAMs) based on their genomic locations, as determined by BLAST-like Sequence Alignment Tool (BLAT) searches (UCSC Genome Browser, July 2007 Mouse Assembly). Unique RAMs in the B6C3F1 mice, as compared to the C57BL/6 mice, at 2 and 4 weeks of PB treatment, were cloned and subjected to BLAT searches (http://genome.ucsc.edu/cgi-bin/hgBlat?command=start&org=mouse). Depending on where, in relation to a gene, the RAM aligned, it was assigned a particular genomic classification (Phillips and Goodman, 2008a). For example, RAMs designated as 1.B.i. are located less than or equal to 2 kb upstream from the transcriptional start site.