Phenotypic and Cytotoxic Analysis of TIL and NK Cells in NSCLC and Ovarian Cancer
This study investigates the phenotypic characteristics and cytotoxic potential of tumor-infiltrating lymphocytes (TIL) and natural killer (NK) cells in non-small cell lung cancer (NSCLC) and ovarian cancer (OvCa). Single-cell suspensions from tumor digests were analyzed using flow cytometry to determine the percentages of various immune cell populations, including regulatory T cells, NK cells, monocytes, and B cells. Additionally, we assessed the cytotoxic capacity of CD4+ T cells and NK cells, revealing significant differences in granzyme B and perforin expression among cancer patients.

Phenotypic and Cytotoxic Analysis of TIL and NK Cells in NSCLC and Ovarian Cancer
E N D
Presentation Transcript
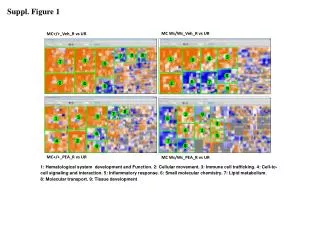
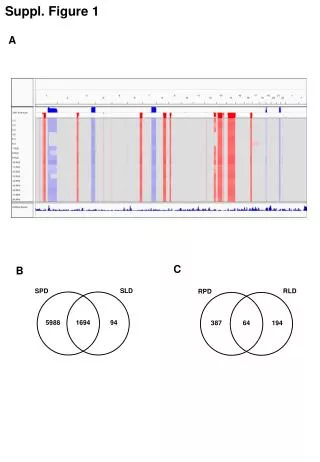
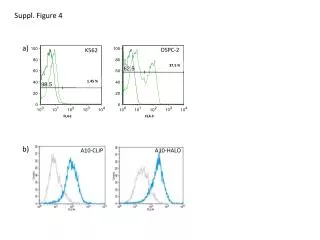
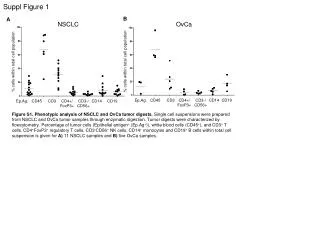
Suppl Figure 1 B A NSCLC OvCa Ep.Ag. CD45 CD3 CD4+/ FoxP3+ CD3-/ CD56+ CD14 CD19 Ep.Ag. CD45 CD3 CD4+/ FoxP3+ CD3-/ CD56+ CD14 CD19 Figure S1. Phenotypic analysis of NSCLC and OvCa tumor digests. Single cell suspensions were prepared from NSCLC and OvCa tumor samples through enzymatic digestion. Tumor digests were characterized by flowcytometry. Percentage of tumor cells (Epithelial antigen+ (Ep.Ag+)), white blood cells (CD45+), and CD3+ T cells, CD4+FoxP3+ regulatory T cells, CD3-CD56+ NK cells, CD14+monocytes and CD19+ B cells within total cell suspension is given for A) 11 NSCLC samples and B) five OvCa samples.
Suppl Figure 2 B A Figure S2. Cytotoxic capacity of TIL and NK cells co-expanded with IL-15, IL-21 or no cytokine producing aAPC. A) Percentage of granzyme B- or perforin-expressing CD4+ T cells was determined by flow cytometry. Percentage of granzyme B+ cells (left) and perforin+ cells (right) within the CD4+ T cell population is shown for 12 patients. B) Percentage of perforin+ cells within the CD3+CD56- NK cell population is shown for six patients. Differences were compared using repeated measures ANOVA’s with a Tukey post test when data followed Gaussian distribution and by using a Friedman test with a Dunn’s post test when data did not pass the normality test. Differences were considered significant when p<0.05, as indicated with an asterisk (* p<0.05, ** p<0.01), *** p<0.001).