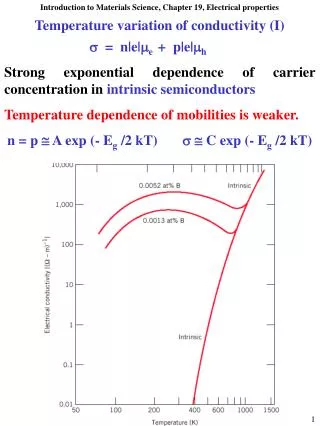
Download
1 / 20
200 likes | 293 Vues
Explore China's temperature trends over the last 60 years using MODIS and meteorological data, highlighting fluctuations and impacted records. Analysis includes trends, anomalies, and historical variations. Research methods involve inversion techniques, testing, and correction processes. Discover urban heat island effects, seasonal variations, and climate change indicators. Study findings reveal shifts in temperatures, with periods of warmth and cooling trends.

E N D
China temperature variation in the last 60 years Jiang Yangming
Content 1.Introduction 2.Test data 3.Research Methods 4.Results Analysis 5.Summary
1. Introduction We use MODIS data to inverse the temperature and its spatial distribution in China over the past 10 years. And use the meteorological data to reconstruct the winter temperature anomaly time series of the urban, suburban, countrysideand meteorological stations’ neighborhood in the last 60 years. We find that: (1) meteorological observatory's temperature records may be affected by urban heat island effect; (2)China temperature fluctuated in the last 60 years and the small fluctuated cycle is about 7 years; (3)On the decade-scale, the biggest decadal temperature increased is 1990s; Although the early 21st century's temperatures is still in the warm period, but it has emerged the downward trend.
2 The Data Used in temperature inversion China Winter Temperature is mainly Controlled by the Siberian cold air, so the temperature’s change is more consistent. We can use winter temperature as the indicators of climate change. We use the 20,22,23,29,31,32 bands of MODIS from 2000-2010 to inverse the temperature. The Coordinate system is WGS84, and the spatial resolution is 0.05 degree. We also use Chinese 722 meteorological stations' temperature records 1951-2009 in the study.
Monthly average temperature’s uniformity test and revise Using all weather stations' monthly data 1951-2009 to establish November, December, January and Winter average temperature series. We systematically analysis each month's temperature trend and the winter temperature trend, then revise the temperature records. Specific steps are as follows: (1)Converse the 722 weather stations' monthly average temperature records to monthly average temperature anomaly data 1951-2009. (2)Test the conversed temperature data. If the monthly temperature anomaly is larger than +5 ℃ or less than -5 ℃, we will analysis the credibility of the stations' temperature records and correct it.
Reconstruct the winter temperature anomaly time series (1)Change Meteorological stations' temperature records into grid temperature data:We mainly use the DEM which spatial resolution is 0.05°×0.05° and the temperature records 1951-2010. The main method is Kriging interpolation. (2)Use MODISdata to inverse the winter average temperature and its spatial distribution 2000-2009. (3) Correct the 1951-2009 temperature which obtained by interpolated the meteorological records based on the temperature spatial distribution matrix .
Reconstruct the winter temperature anomaly time series Spatial distribution map of China winter temperature
Reconstruct the winter temperature anomaly time series Winter temperature distribution map of 2000 year based on interpolation
4.1 Temperature records affected by Urban heat island effect We use MODIS data to inverse China winter temperature anomaly trends 2000-2009, and find that temperature records affected by Urban heat island effect. Winter temperature anomaly trend in China (3-point sliding average curve) from 2000 to 2010
4.2 Centennial Temperature Variation Analysis Greenland temperatures change chart and the temperature changes in China (Zhu Kezhen, 1973)
4.2 Centennial Temperature Variation Analysis (1) The first two thousand years in Chinese historical five thousand years, the annual average temperature was 2 degrees Celsius higher than now. (2) Cold period started in the first millennium BC (Late Yin, early Zhou Dynasty), four centuries AD (the Six Dynasties), one thousand two hundred years AD (Song Dynasty) and one thousand seven hundred years AD(the Ming and Qing Dynasty). The Han and Tang dynasty was relatively warmer. (3)In each 400 to 800 years,we can separate 50-100 years cycle as a small climate variation cycle, the temperature range form 1 ℃ to 0.5 ℃ .
4.3 Decadal Temperature Variation Analysis Apply the cosine of the grid's latitude as weight,Calculate 1951-2009 China decadal temperature anomaly trend(figure 6),and find that compared to 1951-1980 average temperature: (1) 1950s and 1960s is the cold period; (2) 1970s -2009 is a warm period, 1990sis the warmest decade of the 20th century ,the maximum of 20th century’s interdecadal temperature range is 0.27 ℃; (3)Although the temperature of the last decade is still higher than the 1951-1980 average temperature, but the temperature has a downward trend.
4.3 Decadal Temperature Variation Analysis Fig6 Interdecadal temperature anomaly trend in Winter since 1950s in china
4.4 Annual temperature variation analysis Fig7 Chinese winter temperature anomaly change trend from 1951 to 2009
4.4 Annual temperature variation analysis Fig8 Winter temperature anomaly trend of Chinese cities since 1950s
4.4 Annual temperature variation analysis Through comparative analysis two graphs we know that: (1)There is 30 years whose winter temperatures higher than the 1951-1980 average temperature has 30 years, and 29 years’ less than the average. (2) Chinese temperature fluctuated over the past 60 years and the small fluctuated cycle is about 7 years; (3) Through the regression analysis on the temperature anomaly, we know that in the last 60 years,China temperature rise about 0.2 ℃, city temperature rise about 0.3 ℃ ;City temperature is higher than countryside(4.05 ℃ ); (4)Since 2000, the temperature variation amplitude decreased,and temperature has a downward trend.
Summary (1) The "Warming" in the last 60 years is a normal phenomenon of climate change. (2) Human activities has some impact on the temperature in some region, such as the urban and suburban is significantly warmer than in countryside.