Download
1 / 5
50 likes | 182 Vues
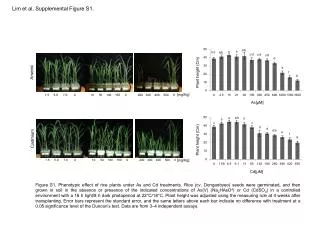
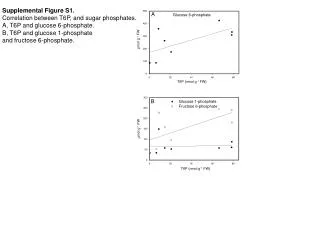
Supplemental Figure S1. Correlation between T6P, and sugar phosphates. A, T6P and glucose 6-phosphate . B, T6P and glucose 1-phosphate and fructose 6-phosphate. µmol g -1 FW. T6P ( nmol g -1 FW). µmol g -1 FW. T6P ( nmol g -1 FW).

E N D
Supplemental Figure S1. Correlation between T6P, and sugar phosphates. A, T6P and glucose 6-phosphate. B, T6P and glucose 1-phosphate and fructose 6-phosphate. µmol g-1 FW T6P (nmol g-1 FW) µmol g-1 FW T6P (nmol g-1 FW)
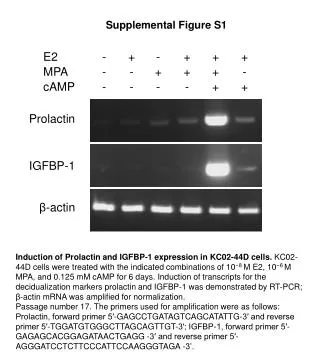
Supplemental Figure S2. SnRK1 activity in most recently fully expanded flag leaves. A, Between 1 and 45 DAA using AMARA and SPS as substrates. B, Between 1 and 45 DAA using AMARA and SPS peptide as substrate in the presence of 1 mM T6P in the assay. SnRK1 activity nmol min-1 mg-1 protein SnRK1 activity T6P inhibition (%)
A TPS (consensus tree) B TPP (consensus tree) TPPE TPS7 TPPH TPPB TPPI TPS6 TPPC TPPJ TPS11 TPS5 TPPD TPS10 TPS9 TPS8 TPS1 TPS4 TPPA TPPF TPS2 TPS3 TPPG Supplemental Figure S3.Phylogenetic trees of Arabidopsis (TAIR9) and Brachypodiumdistachyon (Bd21_v1 gene models) protein sequences for the TPs and TPP gene families. Trees were created with the PHYML program (Guindon et al., 2005) implementing the WAG model of amino-acid substitution (Whelan and Goldman, 2001) from a full-length alignment (excluding gaps). Consensus trees from 100 bootstrap runs shown. A, trehalose phosphate synthase. B, trehalose phosphate phosphatase.
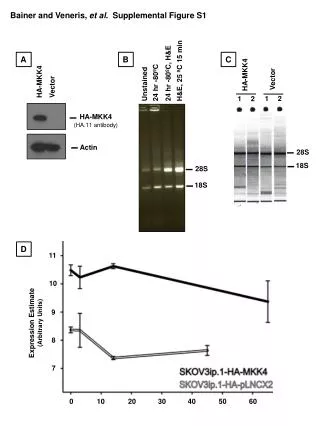
β1 AKIN10 γ β3 Supplemental Figure S4.SnRK1 gene transcript abundance during grain development. Multiple wheat Affymetrix probesetswhich can match to more than one Arabidopsis gene are plotted. A, AKIN10 ●, Ta.2525.1.S1; ○, TaAffx.92935.1.A1;▼, Ta.1312.1.S1; ■, Ta.27319.1.S1. B, β3 subunit. ●, Ta.19103.1.S1_x; ○, Ta.19103.1.S1 C, βγsubunit. Ta.9920.1.S1. D, β1 subunit. ●, Ta.13624.1.S1; ○, Ta.13624.2.S1; ▼, Ta.3840.1.S1_at; ∆, Ta.3840.2.S1_at. E, γ subunit. ●, Ta.6899.3.S1_a; ○, Ta.6899.1.S1 βγ
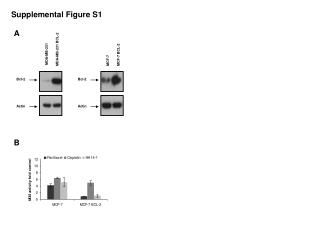
A T6P 8 L1P 6 CPS x10 5 4 2 0 B 8 6 CPS x10 5 4 M6P 2 0 C 8 S6P 6 CPS x10 5 4 2 0 10 12 14 16 18 20 22 24 26 Minutes Supplemental Figure S5.Separation of phospho-disaccharides with identical mass as T6P in wheat extracts using the LC/MS method described by Delatte et al. (2009). Counts per second (CPS) of ions of a specific mass. A, Internal standard lactose-1-phosphate (L1P) added prior to extraction. B, With maltose-6-phosphate (M6P) added before injection. C, With sucrose-6-phosphate (S6P) added before injection.