Supplementary Material and Figures
80 likes | 101 Vues
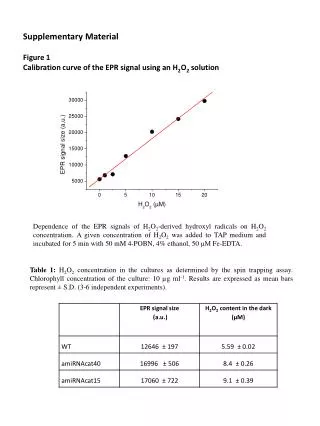
Analysis of CDK4/6 cell-cycle pathway in leiomyosarcomas as a potential target for inhibition by Palbociclib. Study includes Western blot and cell cycle analyses, inhibition assays, and microscopic findings after Palbociclib treatment.

Supplementary Material and Figures
E N D
Presentation Transcript
Supplementary Material and Figures Analysis of the CDK4/6 Cell-Cycle Pathway in Leiomyosarcomas as a Potential Target for Inhibition by Palbociclib Michael J. Böhm1, Ralf Marienfeld1, Daniela Jäger1, Kevin Mellert1, Adrian von Witzleben1, Silke Brüderlein1, Mathias Wittau2, Alexandra von Baer3, Markus Schultheiss3, Regine Mayer-Steinacker4, Frank G. Rücker4, Peter Möller1, Lars Bullinger5, Thomas F.E. Barth1 1Institute of Pathology, Ulm University 2Department of General and Visceral Surgery, Ulm University 3Department of Trauma Surgery, Ulm University 4Department of Internal Medicine III, Ulm University 5Medical Department, Division of Hematology, Oncology and Tumor Immunology, Charité - Berlin
Supplementary Figure S1 (A) Western blot analysis of LMS cell lines SK-LMS-1 and SK-UT-1 for Rb, CDK6, CDK4 and p16 compared to HeLa cells. -tubulin was used as loading control. (B) Inhibition assay of SK-LMS-1 over 24 and 48 hours with palbociclib concentrations ranging from 100-2000 nmol/l. The second row from above shows a concentration-dependent decrease in p-Rb (Ser780). ERK2 is shown as loading control.
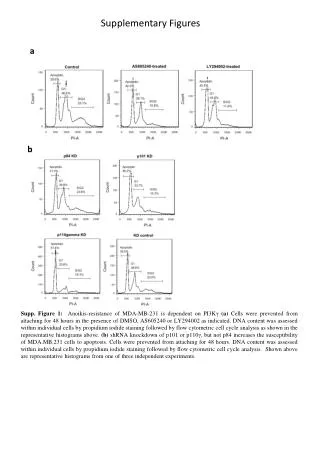
Supplementary Figure S2 (A) Flow cytometric cell cycle analysis for SK-LMS-1 after 24 and 48 hours of palbociclib inhibition. * = p ≤ 0.05, ** = p ≤ 0.01, **** = p ≤ 0.0001 (B) Cell counting graph of SK-LMS-1. Incubation with 100 and 1000 nmol/l concentrations of palbociclib for up to 3 days, followed by automated cell counting every 24 hours.
Supplementary Figure S3 Microscopic findings of SK-LMS-1 after palbociclib inhibition. The left side shows the untreated sample for comparison purposes. (A) Treated cells show a decrease in Ki-67 as expression of growth inhibition. (B) Cleaved-Caspase-3 staining demonstrates no apoptotic activity. (C) May-Grünwald-Giemsa (MGG) staining of cells directly cultivated on microscopic slides. Treated cells show formation of multinuclear cells. Bars: 100 µm
Supplementary Table S2 Sample overview of Affymetrix Oncoscan cohort and respective clinical tumor types Supplementary Table S3 Clinical data table for patients analysed by immunohistochemistry. Age, gender and primary tumour site grading are given. Available data on primary tumour size in centimetres and documented metastasis are outlined alongside life status and observed survival. Abbreviations: f, female; m, male; 0, alive; 1, dead;
Supplementary Table S4 STR profilesforbothleiomyosarcoma cell lines. ComparisonofSTRprofilesfromATCCandExPasYdatabaseto cell linesused in ourin vitro experiments. MatchingSTRsarehighlightedbygreenbackground.