Download

1 / 11
110 likes | 218 Vues
This report presents the findings from a survey conducted by Tucker Ross regarding summer reading habits among library-goers at Poolesville Library, where 18 individuals participated. Key statistics include the mean of 8.8 books read, a median of 5.5, and modes of 2, 3, and 20. A comparative analysis of misleading graphs highlights potential biases in the data collection process, including samples taken exclusively at the library and after school hours. The survey indicates that reading preferences may vary by gender, although the sample size limits the reliability of this conclusion.

E N D
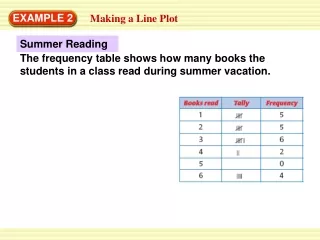
I surveyed 18 people at the Poolesville Library. Here are my results: How many books did you read over the summer?
Realistic Graph This graph accurately represents the data I collected.
Misleading Graph This graph is misleading because I changed the intervals so that the data looks lower than it really is.
Mean The Mean of my data is 8.8. I got this because I added the numbers up and divided them by how many there were. 0+2+2+2+3+3+3+4+5+6+8+9+10+12+20+20+20+30=150÷18 = 8.8
Median The median for my data is 5.5. I got this by putting the numbers from least to greatest. 0,2,2,2,3,3,3,4,5,6,8,9,10,12,20,20,20,30 Then I took the numbers in the middle, 5 and 6, added them together and then divided by 2 to get the median number. 5+6 = 11 ÷ 2 = 5.5
Mode The mode of my data is 2,3, and 20. I got this by counting how many times a number came up. The number with the most times of showing up in the data is called the mode. In my survey the numbers 2, 3 and 20 appeared three times each.
Range The range of my data is 30. I got this by subtracting 0 from 30. You get the range by subtracting the lowest number from the highest.
Central Tendency The best central tendency for my data is the mean. I know this because there is no outlier.. The mode wouldn’t be a good choice because there is more than one mode in my data. This is why the mean is my measure of central tendency.
Biased My survey was biased for several reasons: • I took my survey at the library. This is biased because people at the library like to read. • I only surveyed people right after school which didn’t give me a large enough sample of people. It did not include those who work in a more traditional 9-5 job. • According to the survey, females read more than males, which may not be true since I didn’t have a large enough sample of people to survey, and maybe more males come to the library in the evening. • It was a convenience sample because I could ask people right at the library.