SlideServe
Menu
Préférences
© SlideServe · v2026

Summer Reading

mdodd avatar
13 diapositives · 175 Views · Jan 03, 2020

Explore student reading habits using line plots with detailed frequency data, assess total readers, and identify students reading four or more books. Practice with letter frequency data, analyze central tendencies, and compare line plots to other displays.
Summer Reading - slide 1
01 / 13Summer Reading
1 / 17

Télécharger la présentation

Summer Reading
Une image / un lien ci-dessous est fourni (tel quel) pour télécharger la présentation

Politique de téléchargement : le contenu du site vous est fourni TEL QUEL pour votre information et votre usage personnel ; il ne peut être vendu, concédé sous licence ni partagé sur d’autres sites sans l’accord de son auteur.Le contenu vous est fourni TEL QUEL, pour votre information et votre usage personnel uniquement. Téléchargez la présentation en cliquant sur ce lien. Lors du téléchargement, si vous ne parvenez pas à télécharger une présentation, l’éditeur a peut-être supprimé le fichier de son serveur.Pendant le téléchargement, si vous ne parvenez pas à obtenir une présentation, le fichier a peut-être été supprimé par l’éditeur.

F I N

Plus de contenu associé

Transcription de la présentation
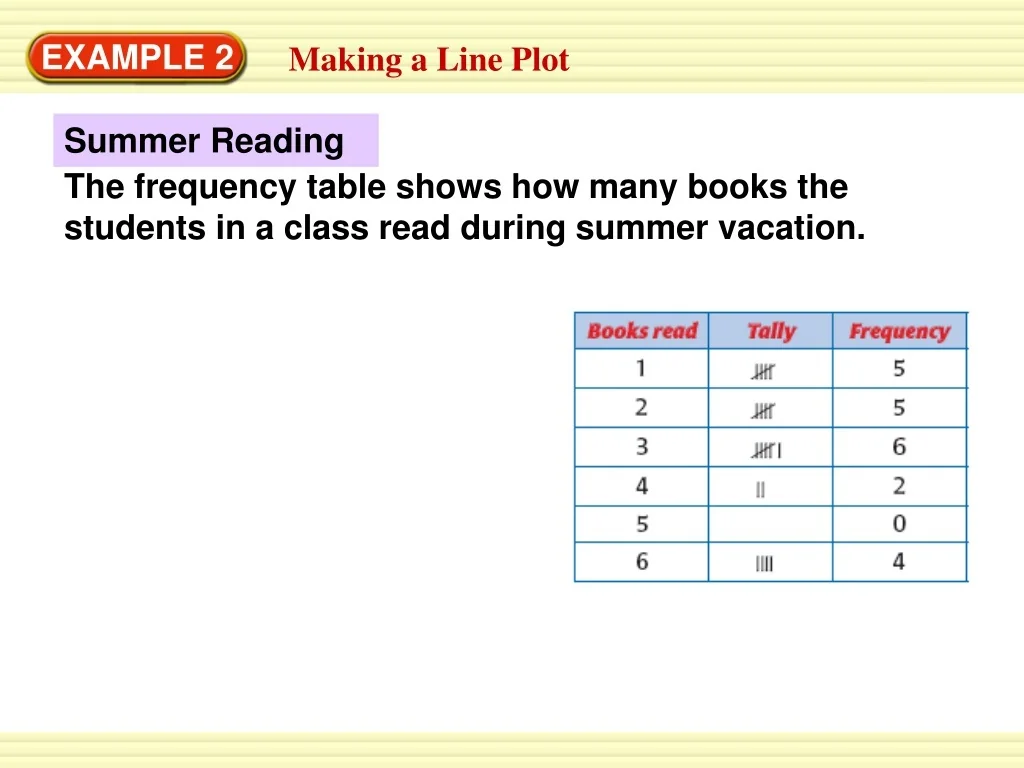
  1. EXAMPLE 2 Making a Line Plot Summer Reading The frequency table shows how many books the students in a class read during summer vacation.

  2. EXAMPLE 2 Making a Line Plot Summer Reading The frequency table shows how many books the students in a class read during summer vacation. • Make a line plot of the data.

  3. EXAMPLE 2 Making a Line Plot Summer Reading The frequency table shows how many books the students in a class read during summer vacation. • Make a line plot of the data. • Use the line plot to find the total number of students.

  4. EXAMPLE 2 Making a Line Plot Summer Reading The frequency table shows how many books the students in a class read during summer vacation. • Make a line plot of the data. • Use the line plot to find the total number of students. • Use the line plot to find how many students read four or more books.

  5. EXAMPLE 2 Making a Line Plot SOLUTION • Make a line plot of the data.

  6. EXAMPLE 2 Making a Line Plot SOLUTION • Make a line plot of the data.

  7. EXAMPLE 2 Making a Line Plot SOLUTION • Make a line plot of the data.

  8. EXAMPLE 2 Making a Line Plot SOLUTION • Make a line plot of the data. • There are 22 x marks in all, so the total number of students is 22.

  9. EXAMPLE 2 Making a Line Plot SOLUTION • Make a line plot of the data. • There are 22 x marks in all, so the total number of students is 22. • The total number of x marks above the numbers 4, 5 and 6 is six, so six students read four or more books.

  10. GUIDED PRACTICE for Example 2 MULTIPLE REPRESENTATIONS The following data show the numbers of letters in students’ names. Use the data in Exercises 3–5. 6, 5, 4, 4, 5, 3, 9, 8, 6, 4, 3, 4, 7, 5, 4, 3, 8, 4, 9, 3 • Make a frequency table of the data. • Make a line plot of the data. • Use it to find out whether more students have names with 3 letters or names with 7 or more letters. Describe which display you choose and how you use it to answer the question.

  11. Using Line Plots

  12. Assessment Prompt • How do you find the central tendencies from a line plot?

  13. Summarizer • A line plot is similar to what 2 other types of data displays? • Write a sentence connecting each dot. Bar graph Line Plot Stem and Leaf