Summer Reading
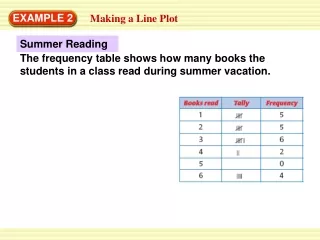
EXAMPLE 2. Making a Line Plot. Summer Reading. The frequency table shows how many books the students in a class read during summer vacation. EXAMPLE 2. Making a Line Plot. Summer Reading. The frequency table shows how many books the students in a class read during summer vacation.


Summer Reading
E N D
Presentation Transcript
EXAMPLE 2 Making a Line Plot Summer Reading The frequency table shows how many books the students in a class read during summer vacation.
EXAMPLE 2 Making a Line Plot Summer Reading The frequency table shows how many books the students in a class read during summer vacation. • Make a line plot of the data.
EXAMPLE 2 Making a Line Plot Summer Reading The frequency table shows how many books the students in a class read during summer vacation. • Make a line plot of the data. • Use the line plot to find the total number of students.
EXAMPLE 2 Making a Line Plot Summer Reading The frequency table shows how many books the students in a class read during summer vacation. • Make a line plot of the data. • Use the line plot to find the total number of students. • Use the line plot to find how many students read four or more books.
EXAMPLE 2 Making a Line Plot SOLUTION • Make a line plot of the data.
EXAMPLE 2 Making a Line Plot SOLUTION • Make a line plot of the data.
EXAMPLE 2 Making a Line Plot SOLUTION • Make a line plot of the data.
EXAMPLE 2 Making a Line Plot SOLUTION • Make a line plot of the data. • There are 22 x marks in all, so the total number of students is 22.
EXAMPLE 2 Making a Line Plot SOLUTION • Make a line plot of the data. • There are 22 x marks in all, so the total number of students is 22. • The total number of x marks above the numbers 4, 5 and 6 is six, so six students read four or more books.
GUIDED PRACTICE for Example 2 MULTIPLE REPRESENTATIONS The following data show the numbers of letters in students’ names. Use the data in Exercises 3–5. 6, 5, 4, 4, 5, 3, 9, 8, 6, 4, 3, 4, 7, 5, 4, 3, 8, 4, 9, 3 • Make a frequency table of the data. • Make a line plot of the data. • Use it to find out whether more students have names with 3 letters or names with 7 or more letters. Describe which display you choose and how you use it to answer the question.
Assessment Prompt • How do you find the central tendencies from a line plot?
Summarizer • A line plot is similar to what 2 other types of data displays? • Write a sentence connecting each dot. Bar graph Line Plot Stem and Leaf